Reflection in Focus – Earth Observation by Radar Satellites
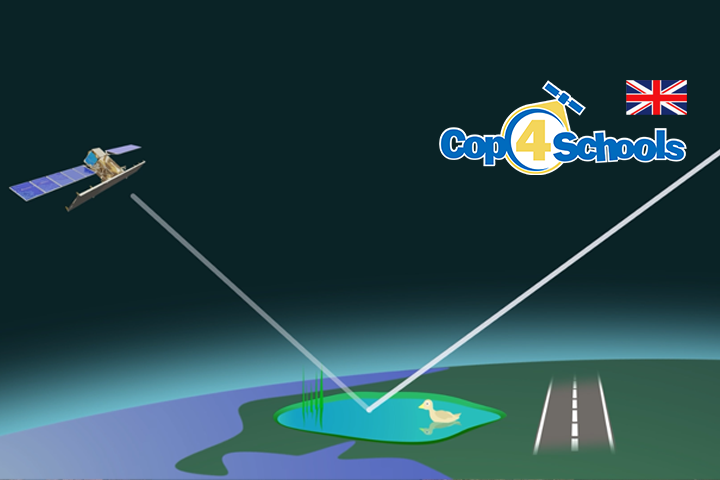
Radar satellites use the reflective properties of the Earth’s surface to gather valuable information. These satellites send electromagnetic waves to the Earth, which are reflected back from the surface and return to the satellite. The analysis of these returning signals makes it possible to identify different materials, structures, and even changes over time. But how do radar satellites use reflection to capture and analyze data about the Earth’s surface? And what can actually be detected in radar images?
- Use the worksheet for this lesson to explore the phenomenon of reflection from the perspective of radar satellites with the help of the satellite image!
-
Watch the learning video and read the operating instructions carefully!
Learning Video:
Operating Instructions:
1. Display the interactive map:
Simply click on ![]() to switch to the interactive map and work with the satellite data. Mit einem Klick auf
to switch to the interactive map and work with the satellite data. Mit einem Klick auf ![]() , you can return here!
, you can return here!
2. Working on the Interactive Map:
- Click on the icon:
 in the interactive map to display details about the satellite data.
 - This button
 displays an image of the dataset on the map (there is only one image in this dataset).
 - You can also use it to hide and show the image again, which is indicated by this icon:


- If you activate this button
 at the bottom of the image, you can read the reflection strength of the pixels. The higher the number (0-255), the stronger the reflection. A click on the image deactivates the mode.

3. What exactly does the tool do?
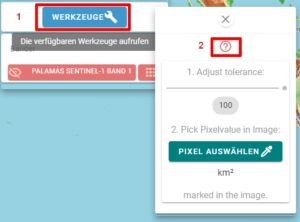
The tool marks pixels in the radar image that look similar, meaning they have similar reflection properties.
You activate the button ![]() and then click on a pixel in the satellite image. The tool will now mark all other pixels in the satellite image that are similar, meaning they have similar reflection properties. You can adjust how similar they need to be using the “Adjust Tolerance” slider.
and then click on a pixel in the satellite image. The tool will now mark all other pixels in the satellite image that are similar, meaning they have similar reflection properties. You can adjust how similar they need to be using the “Adjust Tolerance” slider. ![]()
- 0 means: Zero tolerance! Only pixels that have exactly the same value (reflection) as the pixel selected in the image will be marked.
- 100 means: Very tolerant! Pixels will be marked that fall within a value range of ±100 around the selected pixel.
After a short calculation time, the tool displays the area of the marked region in square meters in the satellite image.
Eotools – hello from the saved content!
